RINEX File Statistics / Information
Observations Statistics
The -stk_only or -stk_obs outputs observations statistics information to STDOUT. Only the nonzero (nonempty) data values are counted.
You can store it into a file using the -fout command line parameter.
Here is an example for the observations file sin12290.14o:
gfzrnx -finp sin12290.14o -stk_obs

 STP sin1 C TYP   C1I   C6I   C7I   D1I   L1I   L6I   L7I   S1I   S6I   S7I
 STO sin1 C C01  2863  2863  2863  2863  2863  2863  2863  2863  2863  2863
 STO sin1 C C02  2863  2863  2863  2863  2863  2863  2863  2863  2863  2863
...
 STO sin1 C C14  1365  1363  1363  1365  1365  1363  1363  1365  1363  1363
 STP sin1 E TYP   C1X   C5X   C7X   C8X   D1X   L1X   L5X   L7X   L8X   S1X   S5X   S7X   S8X
 STO sin1 E E11   900   895   893   899   900   900   895   893   899   900   895   893   899
 STO sin1 E E12  1230  1230  1230  1230  1230  1230  1230  1230  1230  1230  1230  1230  1230
 STO sin1 E E19  1605  1601  1601  1603  1605  1605  1601  1601  1603  1605  1601  1601  1603

 STP sin1 G TYP   C1C   C2W   C2X   C5X   D1C   ...   L1C   L1P   L1W   L2W   L2X   L5X   S1C ...
 STO sin1 G G01  1189  1148  1181  1181  1189   ...  1189     0     0  1148  1181  1181  1189 ...
...
 STO sin1 G G10   886   881     0     0   886   ...   886     9     9   881     0     0   886 ...
...
 STO sin1 G G32  1247  1241     0     0  1247   ...  1247     0     0  1241     0     0  1247 ...
 STP sin1 J TYP   C1C   C1X   C1Z   C2X   C5X   C6L   D1C   L1C   L1X   L1Z   L2X   L5X   L6L ...
 STO sin1 J J01  2863  2863  2863  2863  2863  2863  2863  2863  2863  2863  2863  2863  2863 ...

 STP sin1 R TYP   C1C   C1P   C2C   C2P   D1C   L1C   L1P   L2C   L2P   S1C   S1P   S2C   S2P
 STO sin1 R R01   713   713   709   706   713   713   713   709   706   713   713   709   706
 STO sin1 R R02  1143  1143  1141  1141  1143  1143  1143  1141  1141  1143  1143  1141  1141
...
 STO sin1 R R24   695   695   695   695   695   695   695   695   695   695   695   695   695

 STO sin1 S TYP   C1C   D1C   L1C   S1C
 STO sin1 S S26  1973  1973  1973  1973
 STO sin1 S S27  2863  2863  2863  2863
...
 STO sin1 S S37  2863  2863  2863  2863
ASCII Time plot of Observables
The -stk_epo command line parameter can be used to create an ASCII time plot to show the availability of observations per PRN (std.) and/or observation type.
In the simplest mode, one has to provide the time bin to be used in seconds (here 1800).
Timeplot per PRN
 STT 20150209 00:00   04:00   08:00   12:00   16:00   20:00   00:00
 STH            +---+---+---+---+---+---+---+---+---+---+---+---+
 STE stas C C05 ************************************************| C05
 STE stas C C06 **********  |   |   |   |   |   |   |   |   ****| C06
 STE stas C C07 |   |   |   **************  |   |   |   |   |   | C07
 STE stas C C08 |   |   |   |   |   |   |   *************** |   | C08
 STE stas C C09 *****************   |   |   |   |   |   |   | **| C09
 STE stas C C10 |   |   |   | ******************|   |   |   |   | C10
 STE stas C C11 ****|   |   |   |   | ******|   |   |   | ******| C11
 STE stas C C12 |   |   |   |   | ********  |   |   |  *********| C12
 STE stas C C14 **********  |   |   |   |   | ********* |   |   | C14
 STS            |---|---|---|---|---|---|---|---|---|---|---|---|
 STE stas E E11 ******* |   |   |   |   | ******|   |   |   |   | E11
 STE stas E E12 *** |   |   |   |   |  *******  |   |   |   |***| E12
 STE stas E E19 *****   |   |   |   |   | ************* |   |   | E19
 STE stas E E20 **  |   |   |   |   | ***************   |   |   | E20
 STS            |---|---|---|---|---|---|---|---|---|---|---|---|
 STE stas G G01 |   |  **************   |   |   | ***** |   |   | G01
 STE stas G G02 *   |   |   |   | ***********   |   |  *********| G02
 STE stas G G03 |   |   | **************|   |   |   |  *****|   | G03
...
 STE stas G G30 |   ******  |   |   | ************  |   |   |   | G30
 STE stas G G31 *** |   |   | ********  |   |   |   |   ********| G31
 STE stas G G32 |   |   *************   |   |   |   |****** |   | G32
 STS            |---|---|---|---|---|---|---|---|---|---|---|---|
 STE stas J J01 **  |   |   |   |   |   |   |   |   |   |  *** *| J01
 STS            |---|---|---|---|---|---|---|---|---|---|---|---|
 STE stas R R01 *****   |   |   |   |***********|   |   |   ****| R01
 STE stas R R02 ********|   |   |   |   *********** |   |   | **| R02
 STE stas R R03 | ********* |   |   |   |   **********  |   |   | R03
...
 STE stas R R22 |   |   |   **********  |   |   ********|   |   | R22
 STE stas R R23 |   |   |   |  *********|   |   | ********* |   | R23
 STE stas R R24 **  |   |   |   | ********  |   |   |*********  | R24
 STH            +---+---+---+---+---+---+---+---+---+---+---+---+
 STT 20150209 00:00   04:00   08:00   12:00   16:00   20:00   00:00
Timeplot per PRN and/or Observation Type
A timeplot per observation type is available, providing the [:[prn/otp]] parameter list. This can be combined with other parameters like -smp, -satsys, --obs_types, -prn, -no_prn etc.
 STT 20150209     00:00   04:00   08:00   12:00   16:00   20:00   00:00
 STH                +---+---+---+---+---+---+---+---+---+---+---+---+
 STE stas E E11     ******* |   |   |   |   | ******|   |   |   |   |     E11
 SOT stas E E11 C1X xxxxxxx |   |   |   |   | xxxxxx|   |   |   |   | C1X E11
 SOT stas E E11 C7X xxxxxxx |   |   |   |   | xxxxxx|   |   |   |   | C7X E11
 SOT stas E E11 C8X xxxxxxx |   |   |   |   | xxxxxx|   |   |   |   | C8X E11
 SOT stas E E11 L1X xxxxxxx |   |   |   |   | xxxxxx|   |   |   |   | L1X E11
 SOT stas E E11 L7X xxxxxxx |   |   |   |   | xxxxxx|   |   |   |   | L7X E11
 SOT stas E E11 L8X xxxxxxx |   |   |   |   | xxxxxx|   |   |   |   | L8X E11
 STE stas E E12     *** |   |   |   |   |  *******  |   |   |   |***|     E12
 SOT stas E E12 C1X xxx |   |   |   |   |  xxxxxxx  |   |   |   |xxx| C1X E12
 SOT stas E E12 C7X xxx |   |   |   |   |  xxxxxxx  |   |   |   |xxx| C7X E12
 SOT stas E E12 C8X xxx |   |   |   |   |  xxxxxxx  |   |   |   |xxx| C8X E12
 SOT stas E E12 L1X xxx |   |   |   |   |  xxxxxxx  |   |   |   |xxx| L1X E12
 SOT stas E E12 L7X xxx |   |   |   |   |  xxxxxxx  |   |   |   |xxx| L7X E12
 SOT stas E E12 L8X xxx |   |   |   |   |  xxxxxxx  |   |   |   |xxx| L8X E12
 STE stas E E19     *****   |   |   |   |   | ************* |   |   |     E19
 SOT stas E E19 C1X xxxxx   |   |   |   |   | xxxxxxxxxxxxx |   |   | C1X E19
 SOT stas E E19 C7X xxxxx   |   |   |   |   | xxxxxxxxxxxxx |   |   | C7X E19
 SOT stas E E19 C8X xxxx    |   |   |   |   |  xxxxxxxxxxx  |   |   | C8X E19
 SOT stas E E19 L1X xxxxx   |   |   |   |   | xxxxxxxxxxxxx |   |   | L1X E19
 SOT stas E E19 L7X xxxxx   |   |   |   |   | xxxxxxxxxxxxx |   |   | L7X E19
 SOT stas E E19 L8X xxxxx   |   |   |   |   | xxxxxxxxxxxxx |   |   | L8X E19
 STE stas E E20     **  |   |   |   |   | ***************   |   |   |     E20
 SOT stas E E20 C1X xx  |   |   |   |   | xxxxxxxxxxxxx     |   |   | C1X E20
 SOT stas E E20 L1X xx  |   |   |   |   | xxxxxxxxxxxxxxx   |   |   | L1X E20
 STH                +---+---+---+---+---+---+---+---+---+---+---+---+
 STT 20150209     00:00   04:00   08:00   12:00   16:00   20:00   00:00
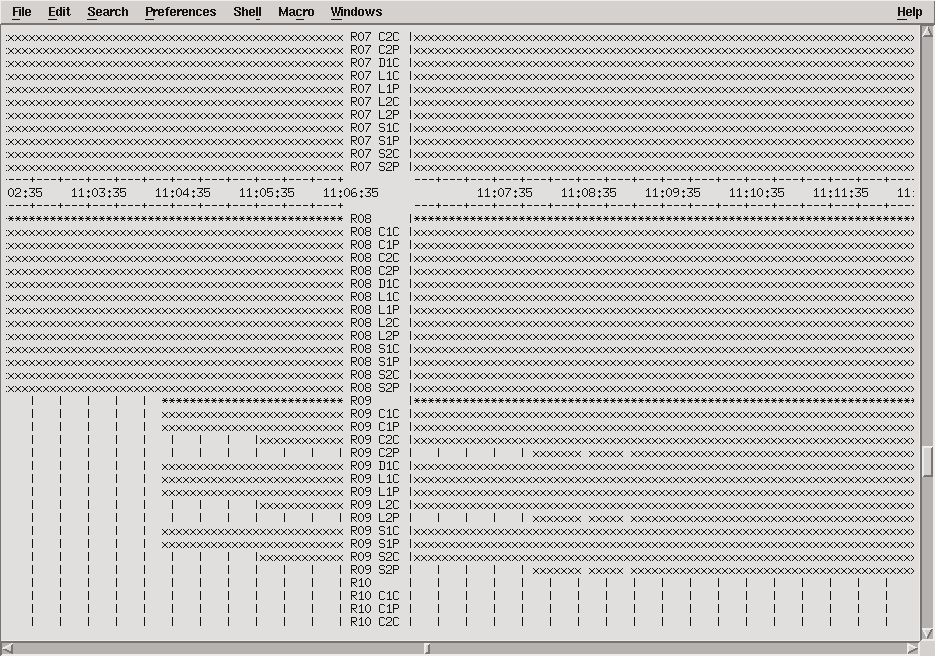
Using an editor that is able to scroll horizontally through a text file (nedit for Unix, or Notepad++ for MS Windows)one can visually check data availability details down to a single observation in case of problems. Here is an example of an input file with 5 s sampling rate: